


-
-
-
![]() Presentationer Håll din publik engagerad.
Presentationer Håll din publik engagerad. -
![]() Dokument Formalisera ditt varumärke.
Dokument Formalisera ditt varumärke. -
![]() Videoklipp Lägg till rörelse i ditt varumärke.
Videoklipp Lägg till rörelse i ditt varumärke. -
![]() Infografik Dela information visuellt.
Infografik Dela information visuellt. -
![]() Utskrivbart Material Skapa innehåll för utskrift.
Utskrivbart Material Skapa innehåll för utskrift. -
![]() Diagram och Infografik Ge liv åt dina data.
Diagram och Infografik Ge liv åt dina data. -
![]() Grafik för Sociala Medier Skapa scroll-stoppande innehåll.
Grafik för Sociala Medier Skapa scroll-stoppande innehåll. -
![]() Mockups Create high-quality mockups in seconds.
Mockups Create high-quality mockups in seconds. -
![]() Branded Templates Get a bundle of templates that match your brand.
Branded Templates Get a bundle of templates that match your brand.
-
-
-
-
-
-
-
![]() Presentationer 1 000 + layouter och teman.
Presentationer 1 000 + layouter och teman. -
![]() Diagram och Kartor Få idéer om datavisualisering.
Diagram och Kartor Få idéer om datavisualisering. -
![]() Grafik för Sociala Medier Bläddra bland mallar för alla plattformer.
Grafik för Sociala Medier Bläddra bland mallar för alla plattformer. -
![]() Infografik Hitta rätt format för din information.
Infografik Hitta rätt format för din information. -
![]() Dokument Mallar för alla affärsdokument.
Dokument Mallar för alla affärsdokument. -
![]() Videoklipp och GIFs Hitta den perfekta föranimerade mallen.
Videoklipp och GIFs Hitta den perfekta föranimerade mallen. -
![]() Branded Templates Get a bundle of templates that match your brand.
Branded Templates Get a bundle of templates that match your brand.
-
-
Online grafskapare
Skapa över 30+ grafer och diagram med lätthet i Vismes grafskapare. Få tillgång till anpassningsbara mallar, live dataintegration och interaktiva graffunktioner. Dela, ladda ner eller bädda in din graf enkelt.
Skapa din gratis graf nu


Används av små och stora märken
Our graph maker is used by over 18,235,768 marketers, communicators,
executives
and
educators
from over 133 countries that include:


Använd grafskaparen för att förvandla rådata till vackra datavisualiseringar.
Använd våra professionellt utformade diagrammallar eller skapa dina egna anpassade diagram, grafer och diagram från grunden.

Skapa alla typer av diagram utan krångel
Gör stapeldiagram, cirkeldiagram, flödesscheman, diagram, linjediagram, histogram och allt däremellan med Vismes grafskapare. Importera data på några sekunder och växla enkelt mellan olika typer av grafer för att hitta den bästa presentationen av dina data.


Fler fantastiska funktioner i diagram- och grafskaparen
Gratis bibliotek med diagrammallar för att starta din datavisualisering
Välj vilken typ av diagram som fungerar bäst för dina data
Använd dina varumärkta teckensnitt och färger för att skapa företagsinnehåll
Enkla drag-och-släpp-designverktyg, gjorda med icke-designern i åtanke
Hjälp din diagramdesign att sticka ut genom att lägga till foton, ikoner, illustrationer och mer
Ladda ner i olika format, lägg till ett annat projekt, dela online eller bädda in
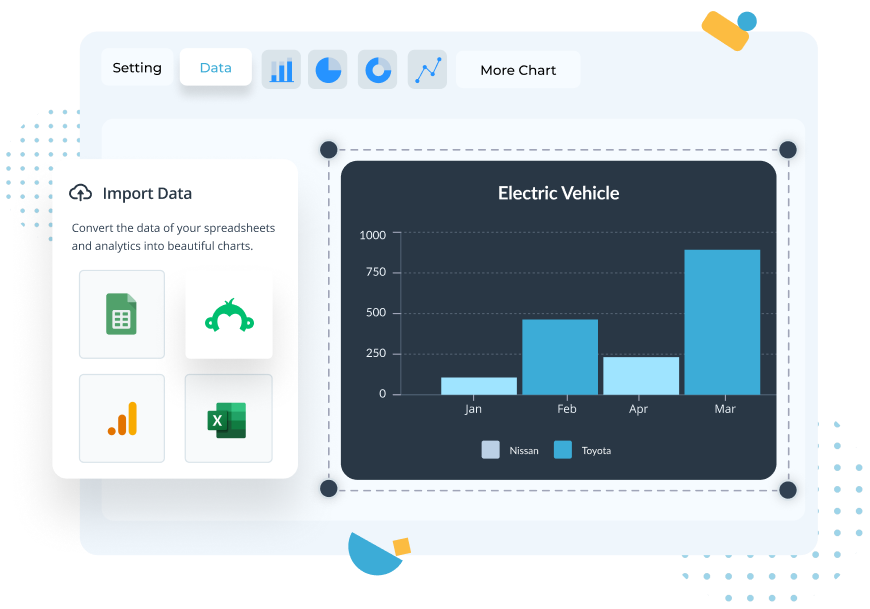
Fyll i diagram och grafer med dina data
Visme gör det enkelt att importera data till dina grafer. Välj att länka Google Sheets, ladda upp Excel-filer, hämta data från befintliga datakällor som Google Analytics eller klistra in dina data i kalkylarket direkt i instrumentpanelen.
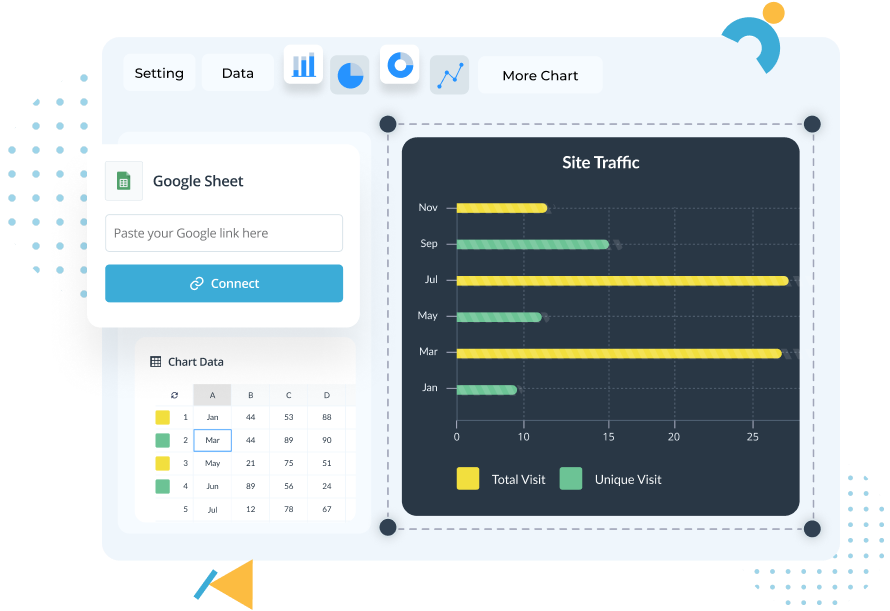
Ladda upp statisk data eller anslut till Google-ark för live-data
Ladda upp dina data som en Excel- eller CSV-fil för att fylla i diagram eller dra direktdata från Google Sheets för att uppdatera dina diagram automatiskt. Dra nytta av grafskaparens lista över integrationer för att skapa grafer baserade på undersökningsdata, webbplatsdata och mer.

Växla sömlöst mellan diagramtyper för att hitta den bästa visualiseringen
När du har infogat dina data i grafskaparen kan du enkelt hitta den bästa typen av diagram eller diagram som fungerar för dina data. Du kan växla mellan diagramtyper både före och efter uppladdning av dina data. Klicka bara genom vår lista över diagramtyper för att hitta det bästa alternativet.

Excel is not the best software when trying to make graphs more interactive and engaging. Visme is just more convenient and has a lot of creative options available straight away.
With Visme, I have yet to miss a reporting deadline. In the past, setting charts up with inferior products required a set of skills learned by deep-diving into capabilities that are not intuitive to everyday operation. Visme has a great amount of presets and templates that make learning easy. I truly enjoy this tool.
I’m a big fan of easy to use tools to create great looking reports, presentations, and charts, and that’s why I like Visme.
Typer av diagram som du kan skapa med Visme
Läs mer om de olika diagramtyperna som finns tillgängliga i vår diagramtillverkare och hitta den rätta för ditt projekt nedan.


Stapeldiagram
Representera kategoriska data med ett vertikalt eller horisontellt stapeldiagram.


Linjediagram
Visualisera linjär data eller information som ändras över tid med ett linjediagram.


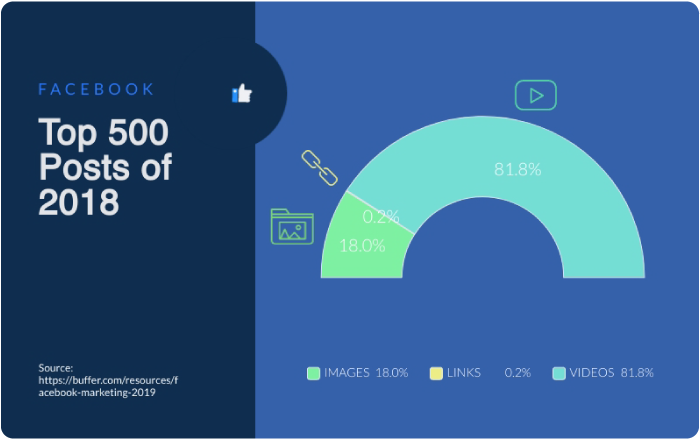


Cirkeldiagram
Skapa ännu fler diagram direkt inuti grafskaparen som histogram, piktogram, flödesscheman, kartor, Venn-diagram, konceptkartor, träddiagram och tankekartor.


Spridningsdiagram
Skapa ännu fler diagram direkt inuti grafskaparen som histogram, piktogram, flödesscheman, kartor, Venn-diagram, konceptkartor, träddiagram och tankekartor.


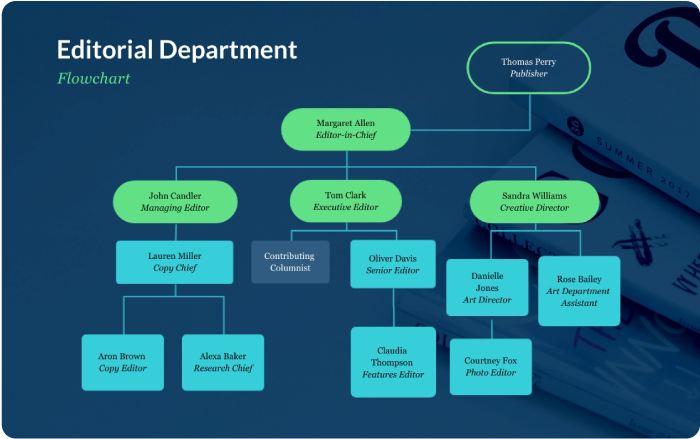


Andra diagram
Skapa ännu fler diagram direkt inuti grafskaparen som histogram, piktogram, flödesscheman, kartor, Venn-diagram, konceptkartor, träddiagram och tankekartor.
Diagrammallar för alla dina databehov
Se till att dina data är lätta att läsa genom att börja med en professionellt utformad diagrammall. För en mer grundläggande diagramdesign kan du enkelt börja om från början innan du lägger till den i ett annat projekt, som en rapport eller presentation.


Dela och ladda ner dina grafer
Det finns ett antal sätt att placera dina datavisualiseringar inför din publik med Vismes grafskapare. Dela dina Visme-projekt online, privat eller ladda ner dem för att infoga i dina egna dokument.


Dela grafer online
Dela ditt diagram eller graf online genom att skapa en länk som kan delas offentligt, bädda in på din webbplats med en inbäddningskod från Visme eller dela din diagramlänk på sociala medier


Dela grafer privat
Skapa ditt diagram eller graf som en krypterad icke-indexerbar URL. Du kan till och med göra det lösenordsskyddat eller bara dela med dina teammedlemmar eller ämnesexperter.


Ladda ner dina grafer
Ladda ner grafen som ett PDF-dokument eller högupplöst bild eller skapa hela din infografik i Visme Ladda ner som HTML5 med full interaktivitet eller som en PowerPoint-fil.


